


Election-Year Cycle
In an analysis performed by Forbes magazine in 2015, there were clear and persistent patterns around the four-year electoral cycle, as the table in this post suggests.
To view the full article please register below:
Election-Year Cycle
[Note: A table sourced from Forbes is a little bit outdated, but perhaps one of your analysts can provide the numbers to make it more current (or produce your own). It may not be necessary, but worth considering.]
The Electoral Cycle and the Markets
Humans by nature are not comfortable with randomness and chaos. When confronted with it, our inclination is to try to explain it in a way that makes the world more understandable. With the financial markets being one of the most unpredictable systems in our daily lives, it’s no wonder that a number of stock prediction theories have been proposed—from the simplistic Super Bowl indicator to the complex Kondratieff Wave.
The Presidential Election Cycle
A president can have meaningful impact on the markets. The president’s policies and ability to lead Congress to enact legislation can affect individual industries and the general economy in ways that lead investors to reprice stocks higher or lower.
In an analysis performed by Forbes magazine in 2015, there were clear and persistent patterns around the four-year electoral cycle, as the table below suggests.
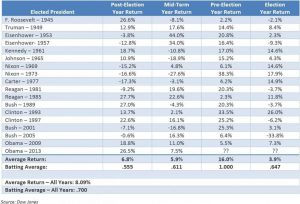
Explanations for this pattern can only be surmised since controlled experiments on the world’s largest economy are not possible. But, it may be reasonable to argue that the outsized relative performance of the third year may be tied to policies enacted and fiscal stimulus timed to support a re-election bid (yes, a tad cynical). The reason for the last year of the election cycle lagging may be the uncertainty that generally accompanies an election, and the markets abhor uncertainty.
A closer examination of individual data points, however, confirms what we know about the limitations of what “the average” can tell us. Each year reflects a wide disparity of returns that prevent any declarations of a hard and fast rule; this stems from the number of other variables that can influence returns during any given year, such as if an election year involves an incumbent president, and whether Congress is in the hands of the opposition party or control is split. Moreover, exogenous factors (e.g., recession, war, etc.) will exert themselves and define market performance much more than the year within the presidential election cycle in which the markets happen to find themselves.
The presidential cycle may not be a basis for making tactical changes to a portfolio, but it may be sufficiently useful in setting client expectations about near-term investment performance.
See referenced disclosure (2) at https://blog-dev.americanportfolios.com/disclosures/